
Accessing and saving logs
Here you'll learn how to find the logs for Communication Panel and your browser.
Accessing and Saving Communication Panel Logs
- Change the log level to High.
- Try to reproduce the problem.Note:If your issue involves call audio, download the log while the call is still in progress.
- Open User menu from the upper right corner.
- Click Download log.
- Navigate to the folder where the log file was saved.
The log file name is [username][date].log, and it is saved to the default download folder.
- Compress (zip) the files before adding them to the ticket.
- Right-click the file and select .
To set the application in the debug mode, open it in the address https://login-[region].cc.sinch.com/[Tenant Name]/ecf/[software version]/communicationpanel/index.html?sap-ui-debug=true. Note that the application starts slow in the debug mode.
Accessing and Saving Browser Logs
Browser’s Console log stores additional information on certificates and on how specific UI components are loaded. Network log stores similar information about accessing Sinch Contact Pro system. The tabs behave differently. Console messages can be generated by the application even if the Console tab is not currently selected, and those messages are typically available when you later switch to the Console. The Network tab only records traffic while Developer tools is open and network logging is active.
- To open the Developer tools panel, press F12 or Ctrl+Shift+I.
- Try to login to Communication Panel and reproduce the problem.
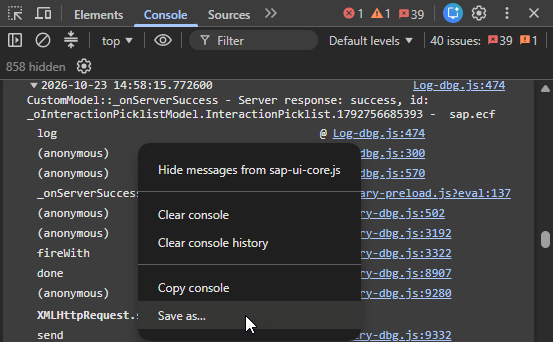
- To get the Console logs:
- Right-click on the Developer tools panel.
- Select Save as...
- To get the Network logs:
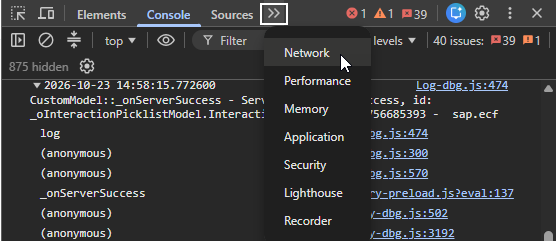
- If the Network tab isn't shown, click
More tabs and choose
Network.
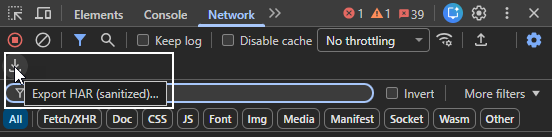
- Click the arrow to export the log.
- If the Network tab isn't shown, click
More tabs and choose
Network.
- Save the log files in your computer.