
Dashboard
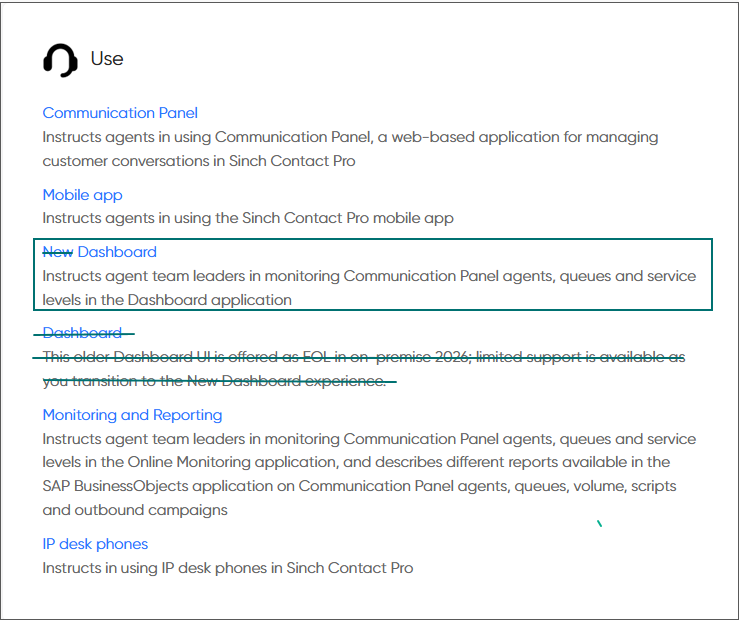
The following changes and improvements have been made in the area of the new Dashboard.
With all key features now available, the new Dashboard is ready for you to explore. We recommend making the switch to take advantage of its enhanced performance and design. Use the direct link [https://[IP|https://[ip/] address]/dashboard/. You can also add the link to CP's user menu in .
Also note that as of the release 2027 onwards, the documentation link to Dashboard in the documentation main page will open to the new Dashboard document.
We’ve made several improvements to enhance usability and consistency across the application:
-
The underlying UI framework has been updated to ensure better performance and improved accessibility.
-
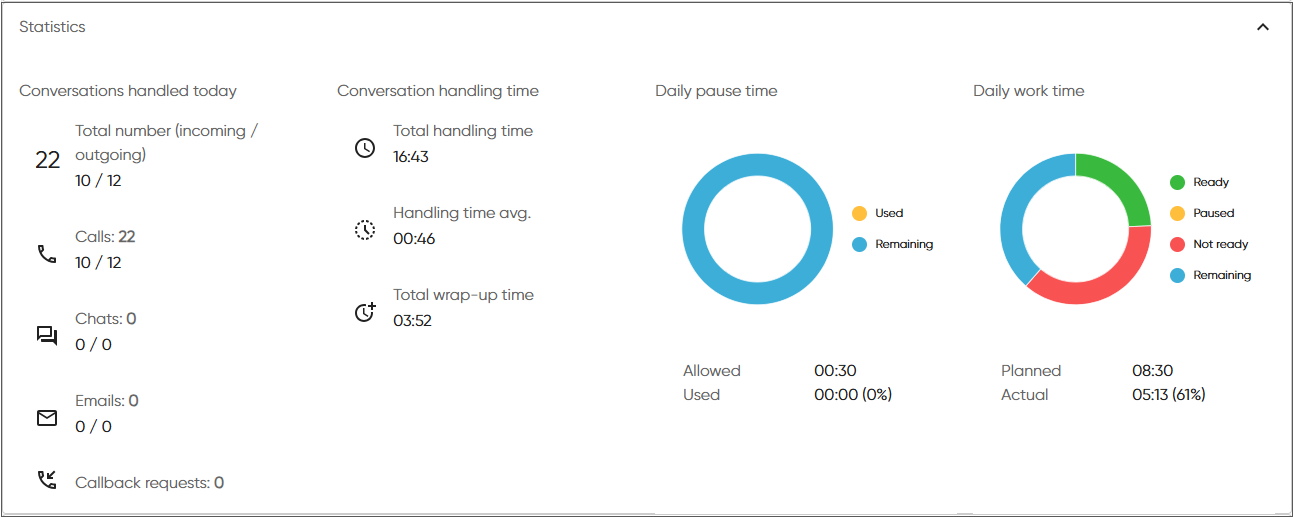
Both Conversation details and Agent details views have been updated with the new look and feel. We’ve also improved how the Statistics section in the Agent details view shows daily pause time and daily work time for easier tracking.
-
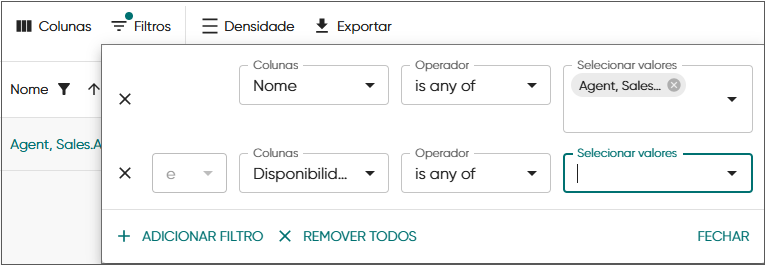
Built-in filter options, with the exception of operator values, are now translated into every supported end-user language.
New cards
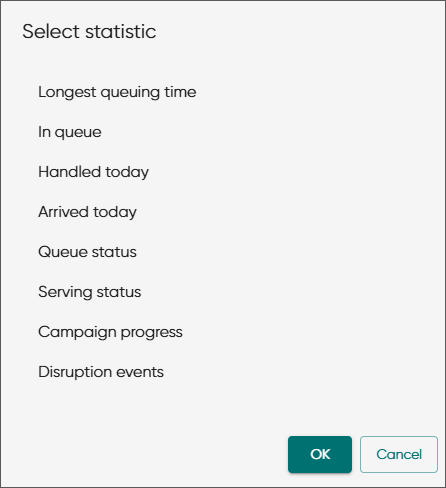
The Statistics view offers the following card types that are fully scalable for large screens and with text that dynamically adjusts to fit the card layout.
Mixed-channel monitoring
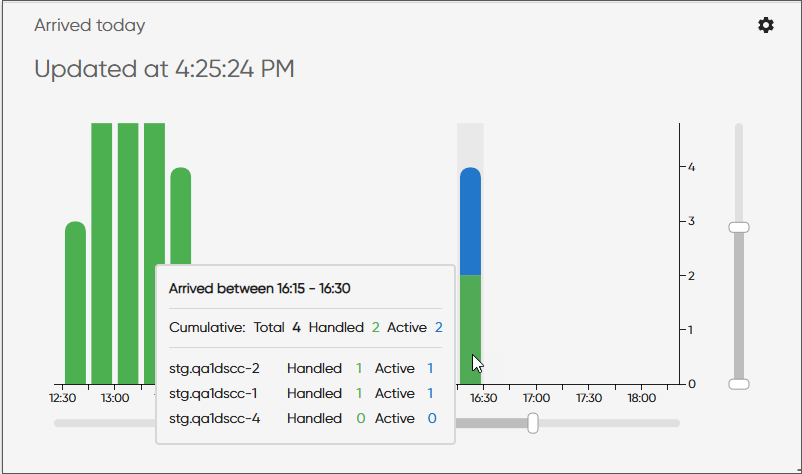
Instead of needing separate cards for calls, emails, and chats, you can monitor a mix of all channel types in one card. Additionally UI recognizes the type of card to build by selection of a single or multiple queues.
Automatic prioritization
When monitoring multiple queues, the card automatically highlights the queue with either the longest-waiting conversation or the largest number of conversations.
Chart types
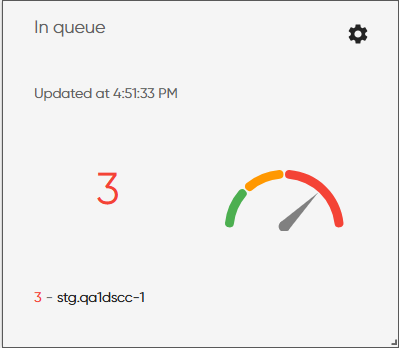
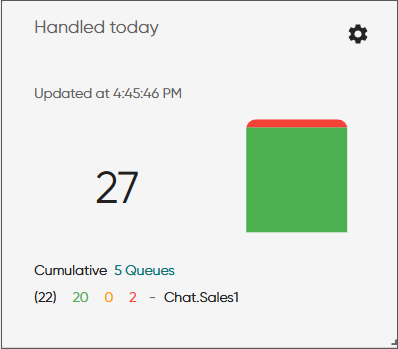
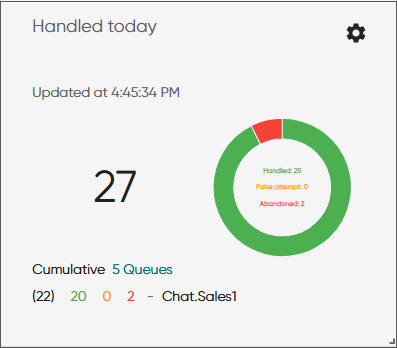
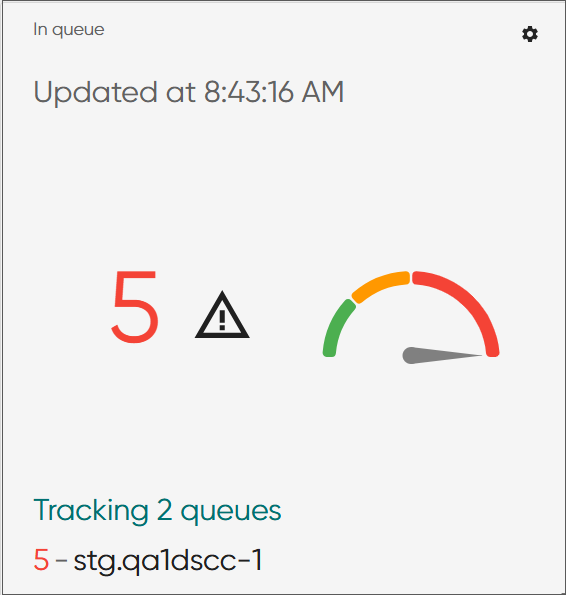
You have the option to configure cards as bar charts, gauges, donut charts, or pie charts depending on the card type.
Alerts
When you define SLA thresholds in System Configurator (SC), cards will automatically change color to show status:
-
green
Queuing time is within accepted time range.
-
yellow
Queuing time warning level is exceeded.
-
red:
Queuing time critical level is exceeded.
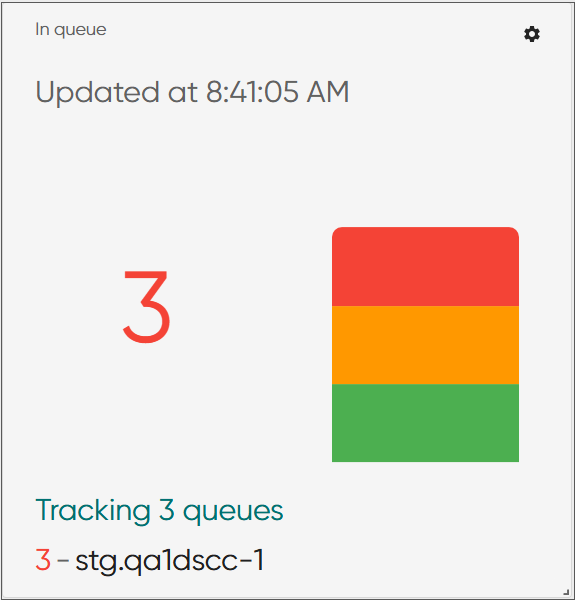
If a queue has a queue size defined in SC, an icon will appear on the card when a predefined limit is met or exceeded.
Other improvements
Showing customer name
The Conversations view shows the customer name for an incoming queue conversation in the Source name column if found in the Directory.

If there are several matches, Dashboard shows the number/email address instead of a name and indicates this with the following:
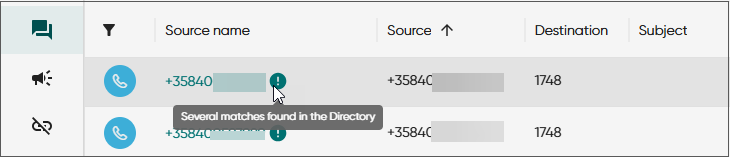
Destination name shows the call recipient name if found in the Directory.

Transcripts and internal notes
The Conversations view has new columns and filtering options for conversations that have a transcript or internal notes.
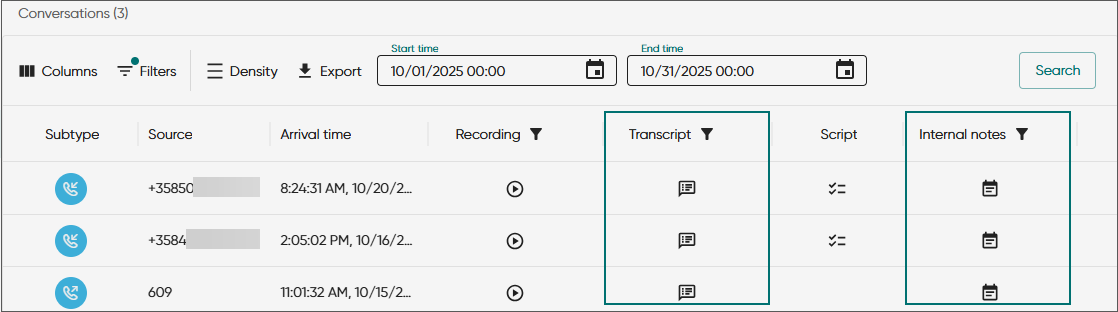
New filtering options:
-
Use the new Transcript filter to find the call conversations that have been transcribed.
-
Use the new Internal notes filter to find all conversations where an internal note has been added.
When a conversation has internal notes, this is also indicated as an event in the Conversation details view.

Campaign customers
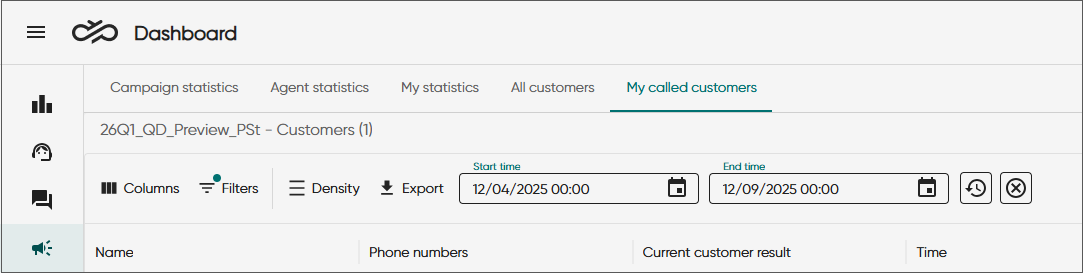
The Campaigns view now has tabs for All customers and My called customers.
Service level card
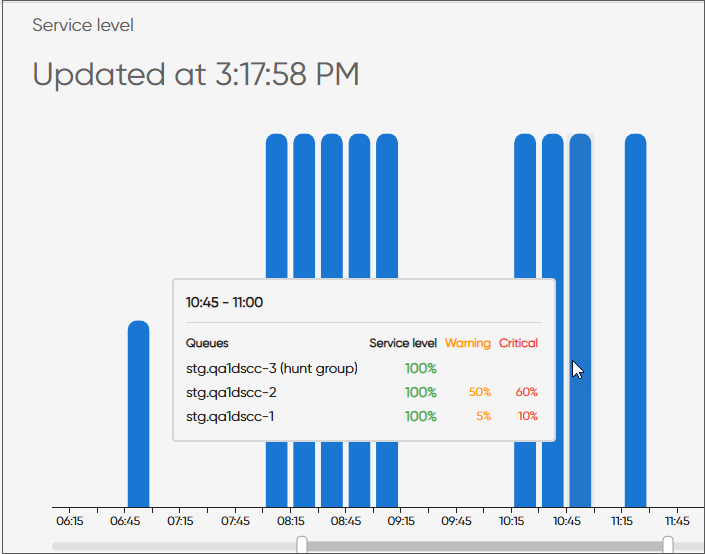
The statistics view now includes a new card: Service level. You can show the service level of queues using four various formats: Gauge, Bar, As a percentage or by as a chart by either Bar per queue or Bar as cumulative. Chart options present the service level in 15‑minute intervals. Hovering the cursor over the interval shows the service level percentage.
User group
Filtering users by their user group is now supported.
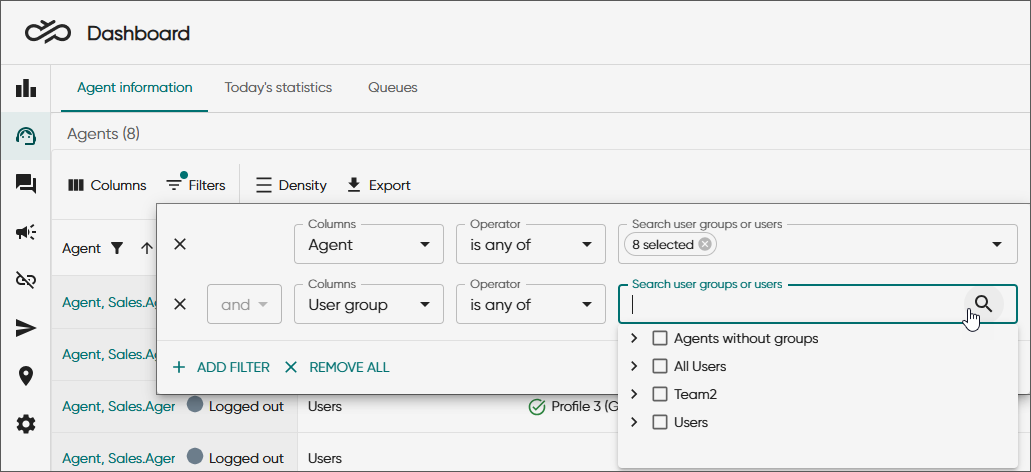
You can select an entire group or expand it to choose only specific agents within that group.
The User group column is hidden by default. It can be selected in the Agents view (Agent information, Today’s statistics, and Queues tabs), the Conversations view, and the Agents table in the Serving status card.
Reporting group colum
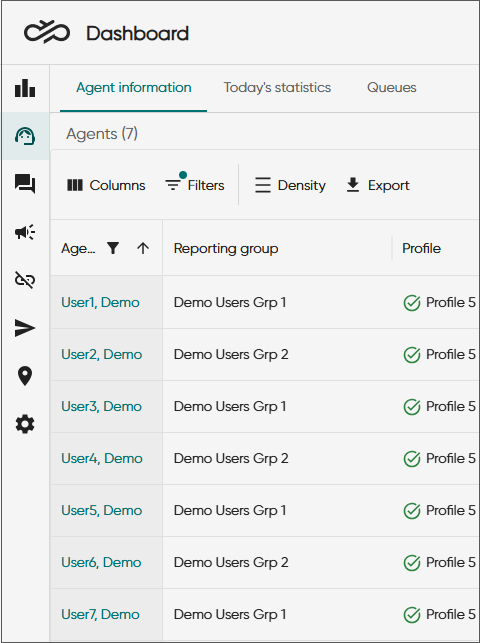
Dashboard now includes a column in the Agents view for showing a user's reporting goup if one has been defined for the user. The Reporting group column is hidden by default. It can be selected in Agent information, Today's statistics, and Queues.
Other improvements
Statistics view
-
Cards with bar charts
-
now save changes made to the axis scaling.
-
allow for slider scaling down to 15-minute intervals.
-
-
The view now provides support for reduced card sizes.
Keyword cloud
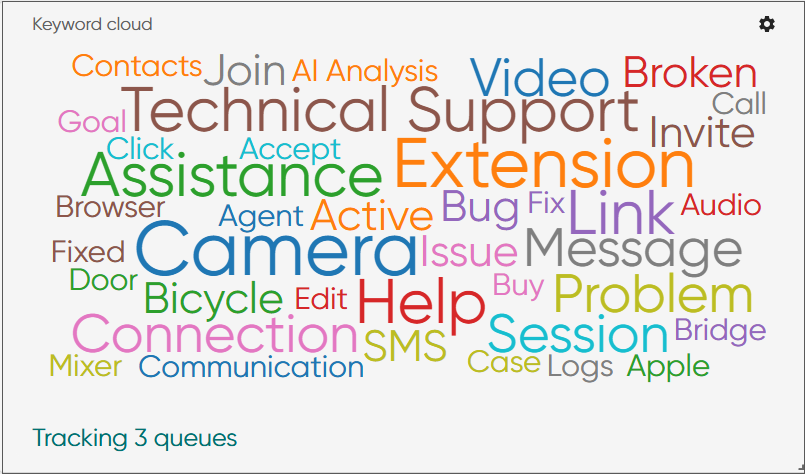
When AI analysis is enabled in the system, it analyzes queue conversation content of calls and emails and produces a summary and a list of keywords. A new card, Keyword cloud, offers a visual summary of conversation content generated by AI. Keywords extracted from the conversation are shown with varying sizes and colors to indicate their relative importance.
Refresh options
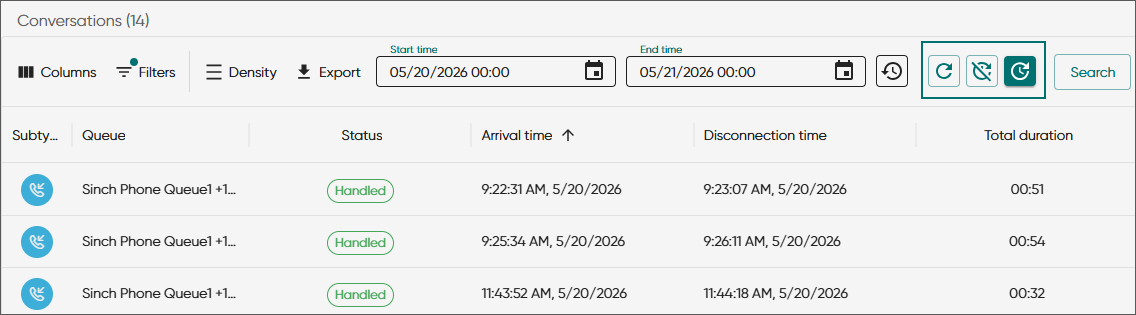
The following views have three options for how to refresh the information in the view: Agents, Conversations, Campaign statistics, Disruptions, and Emergency locations. The options are:
-
Manual refresh

-
No refresh

-
Auto-refresh

Auto-refresh is the default for the Today's statistics tab in the Agents view and for the Conversations view when the date range includes the current day. The other views have no refresh selected by default.
New filters
Dashboard has two new options in the Filters menu:
-
Queue group in the following views:
-
Queues tab in the Agents view
-
Conversations
-
-
Reporting group in the following views:
-
Agents:
- Today’s statistics
- Queues
-
Statistics view > Serving status > Agents card
-

Profile and Conversations columns
The columns Profile and Conversations have been added to the Today's statistics tab in the Agents view.